How the F3K Pilot Rating System Works
The Idea
Every F3K pilot has a single number — their rating — that reflects how strong they are right now. Win against tough opponents, your rating climbs. Lose to weaker pilots, it drops. Stop competing for a while, it gradually fades.
The system borrows from chess ELO but adapts it for F3K's unique structure: multiple pilots competing simultaneously in a flight group, where seconds of flight time determine who outperformed whom.
The Match Unit: Flight Groups
In F3K competitions, pilots are assigned to flight groups. Everyone in a group flies the same task, at the same time, under the same weather conditions. This is what makes the rating system fair — we never compare pilots who flew in different conditions.
Each group becomes one "match" for the rating system. A typical competition has 7–14 rounds with 2–4 groups each, so a weekend event generates 20–50 rating events per pilot.
How a Single Group Updates Ratings
When a group finishes flying, the system compares every pilot against every other pilot in that group. For a group of 8 pilots, that's 28 pairwise matchups per pilot.
Worked Example
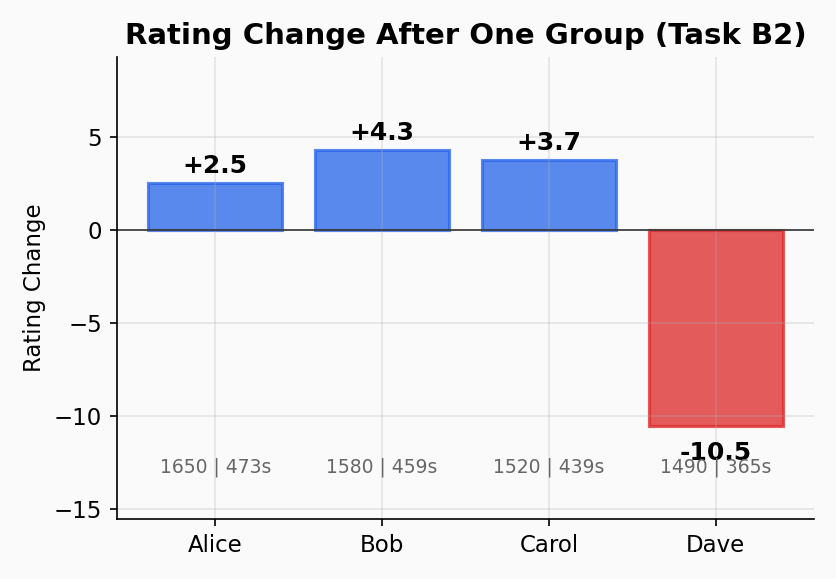
Four pilots compete in a Task B (Best 2 flights, 4 min max, 10 min working time):
| Pilot | Flight Times | Total (seconds) | Rating Before |
|---|---|---|---|
| Alice | 3:58 + 3:55 | 473 | 1650 |
| Bob | 3:52 + 3:47 | 459 | 1580 |
| Carol | 3:41 + 3:38 | 439 | 1520 |
| Dave | 3:10 + 2:55 | 365 | 1490 |
For each pair, the system computes two things:
1. Expected Score — what should happen based on current ratings:
E = 1 / (1 + 10^((opponent_rating - your_rating) / 400))
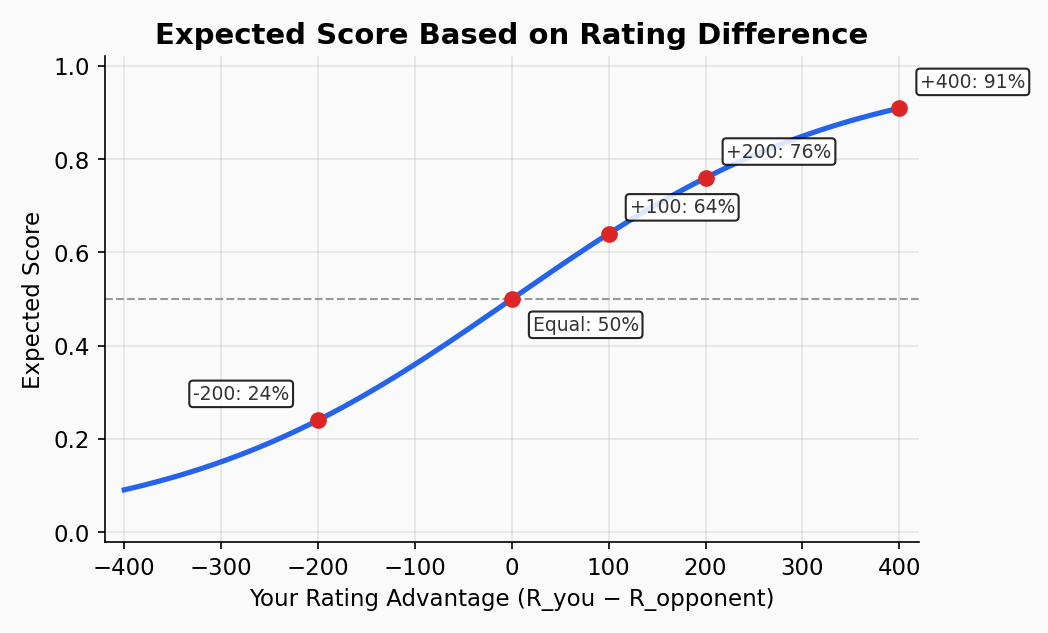
Alice vs Bob: E = 1 / (1 + 10^((1580-1650)/400)) = 0.60 Alice vs Carol: E = 1 / (1 + 10^((1520-1650)/400)) = 0.68 Alice vs Dave: E = 1 / (1 + 10^((1490-1650)/400)) = 0.72
Alice is expected to beat all three — she's the highest rated.
2. Actual Score — what did happen, with margin of victory:
S = 1 / (1 + e^(-(your_points - their_points) / margin_scale))
The margin scale varies by task (see below). For Task B2 (scale=45):
Alice vs Bob (473 - 459 = +14): S = 0.58 (slight win) Alice vs Carol (473 - 439 = +34): S = 0.68 (solid win) Alice vs Dave (473 - 365 = +108): S = 0.92 (dominant win)
3. Rating Change:
delta = K × group_scale × (S_total - E_total) / sqrt(N - 1)
Where group_scale = min(1.0, (N - 1) / 7). For this 4-pilot group: group_scale = 3/7 = 0.43.
Alice's totals: S_total = 0.58 + 0.68 + 0.92 = 2.18, E_total = 0.60 + 0.68 + 0.72 = 2.00
delta = 24 × 0.43 × (2.18 - 2.00) / sqrt(3) = 24 × 0.43 × 0.18 / 1.73 = +1.1
Alice performed slightly better than expected — she gains 1.1 points. Her rating moves from 1650 to 1651.1. The small group size (4 pilots) reduces the impact compared to a full 8+ pilot group where she'd gain +2.5.
What about Dave?
Dave lost all three matchups, but the system considers how much he was expected to lose:
Dave vs Alice: E = 0.28, S = 0.08 Dave vs Bob: E = 0.37, S = 0.12 Dave vs Carol: E = 0.46, S = 0.17
S_total = 0.37, E_total = 1.11
delta = 24 × 0.43 × (0.37 - 1.11) / 1.73 = -4.4
Dave loses 4.4 points. He was expected to lose, but he lost by larger margins than his rating predicted. In a full-size group (8+ pilots), the loss would be larger — but the small group size limits the impact.
Margin of Victory Matters
The system doesn't treat a win as just a win. Beating someone by 200 seconds counts more than beating them by 5 seconds.
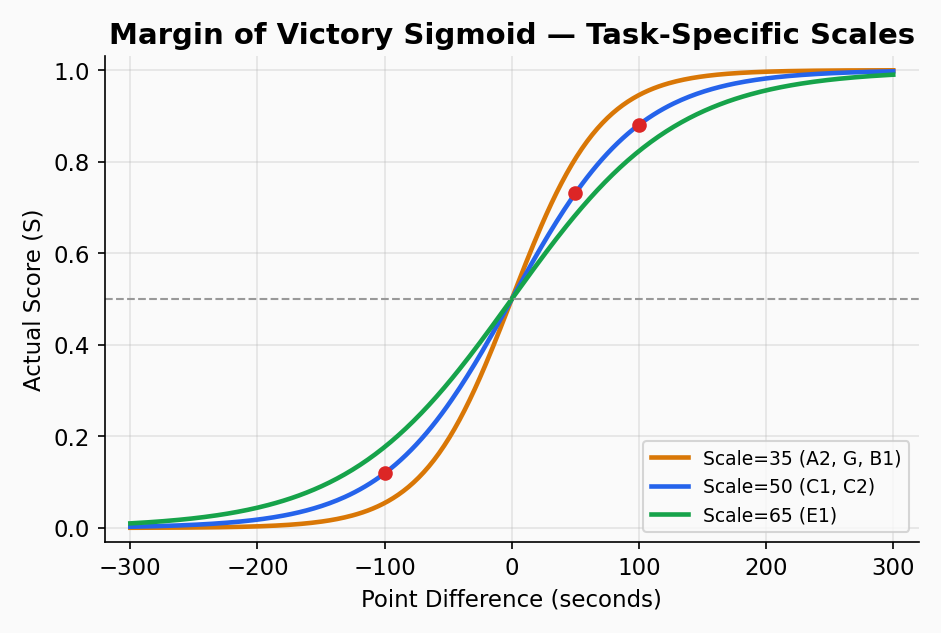
The margin sigmoid converts point differences into scores between 0 and 1:
Task-Specific Margin Scales
Not all tasks have the same range of possible margins. In Task A2 (Last Flight, 7 min), most good pilots land within seconds of 5:00 — the ceiling is hard to exceed and easy to hit. In Task E1 (Poker), declared times create huge variance and margins of 60+ seconds are common.
A fixed scale would punish top pilots in ceiling-capped tasks: they'd be "expected" to win by margins that are physically impossible. The system accounts for this by using a task-specific margin scale that reflects how spread out scores naturally are for each task:
| Task Group | Margin Scale | Why |
|---|---|---|
| A2, B1, G | 35 | Hard time ceiling — everyone near max, margins compressed |
| F, J | 40 | Short max flight time limits differentiation |
| A1, B2, H, I, K, L2 | 45 | Moderate ceiling effects |
| C1, C2 | 50 | Multiple flights add variance |
| C3, D | 55 | Longer tasks with more room to differentiate |
| L1, N | 55–60 | Single long flight — high risk/reward |
| E1, E3 | 65–70 | Poker tasks — declared times create wide spread |
| E2, M | 70–75 | Longest working windows, maximum variance |
This means a 10-second win in Task G (2 min max, scale=35) generates the same ELO impact as a 19-second win in Task E1 (scale=65). Both represent "winning by a typical competitive margin for that task."
| Point Difference | Score (scale=35) | Score (scale=50) | Score (scale=65) |
|---|---|---|---|
| +5 | 0.57 | 0.55 | 0.54 |
| +15 | 0.65 | 0.57 | 0.56 |
| +30 | 0.70 | 0.65 | 0.61 |
| +50 | 0.81 | 0.73 | 0.68 |
| +100 | 0.95 | 0.88 | 0.82 |
This means maxing out a flight (landing exactly at the target time) matters — every second counts toward your rating. But it also means you won't be penalized for "only" winning by 10 seconds in a task where 10 seconds is a dominant margin.
Beating Stronger Pilots Rewards You More
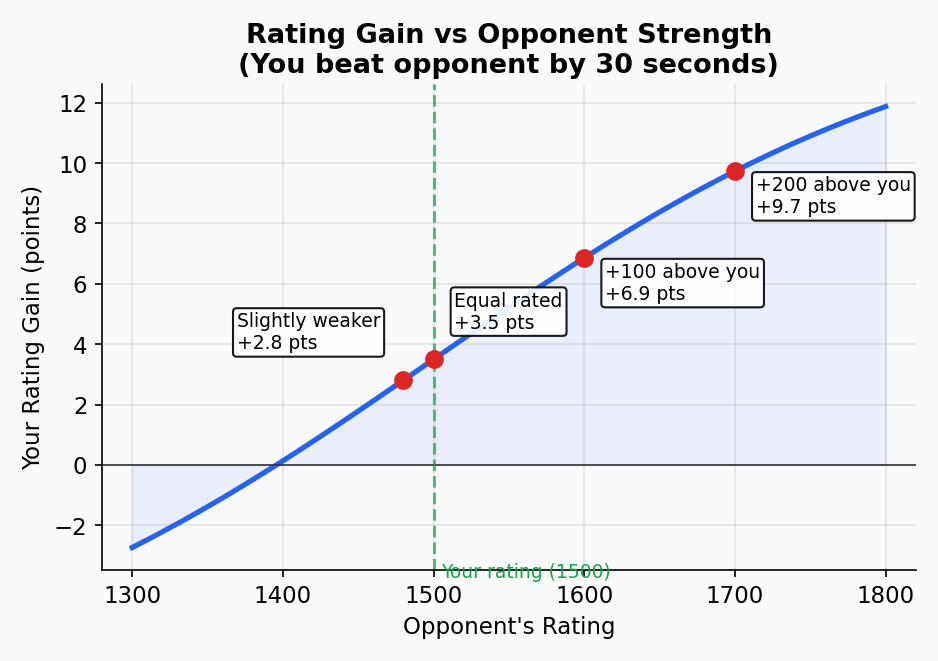
The expected score is based on the rating gap between you and your opponent. When you beat someone rated much higher than you, your expected score was low — so the surprise factor is large.
Example: The Upset
Scenario: A 1500-rated pilot beats a 1700-rated pilot by 30 seconds in Task C1 (scale=50).
Expected score against the 1700 pilot: E = 1 / (1 + 10^((1700-1500)/400)) = 0.24 Actual score (30-second margin): S = 1 / (1 + e^(-30/50)) = 0.65
Surprise = S - E = 0.65 - 0.24 = +0.41
Scenario: The same 1500-rated pilot beats a 1480-rated pilot by 30 seconds.
Expected score: E = 1 / (1 + 10^((1480-1500)/400)) = 0.53 Actual score: S = 0.65 (same margin, same score)
Surprise = 0.65 - 0.53 = +0.12
The same flight performance (winning by 30 seconds) generates 3.4x more rating gain when it's against a pilot rated 200 points above you versus one rated 20 points below you.
This is why competing in strong groups at major events is the fastest path to a high rating — and why dominating weak local fields produces only modest gains.
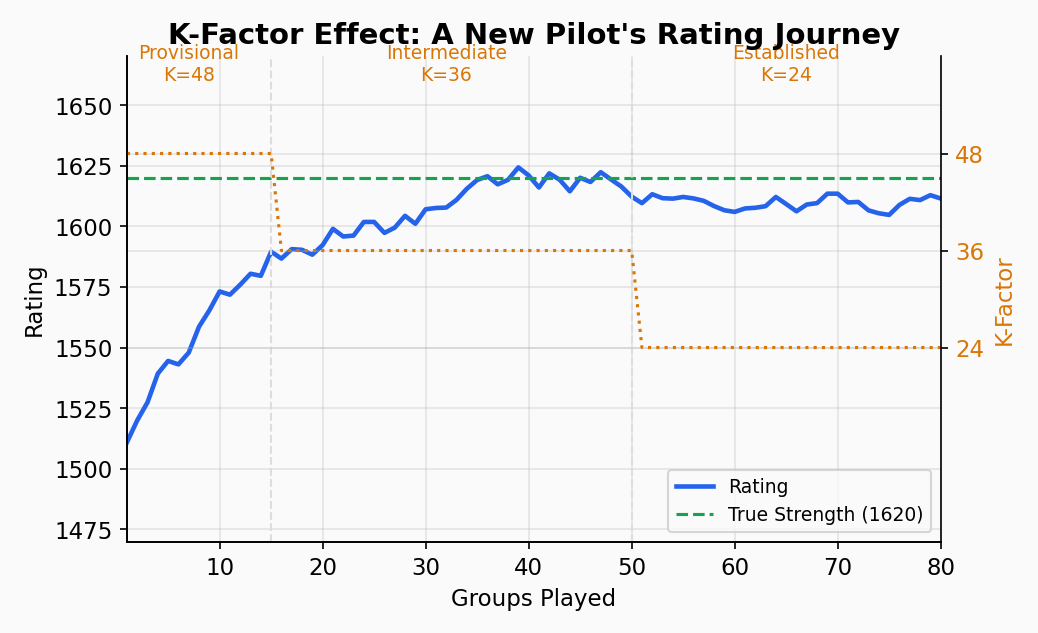
K-Factor: How Fast Ratings Move
New pilots need their ratings to adjust quickly to find their true level. Established pilots should have more stable ratings. The K-factor controls this:
| Experience Level | Groups Played | K-Factor | Character |
|---|---|---|---|
| Provisional | 0–15 | 48 | Rating moves fast — finding your level |
| Intermediate | 16–50 | 36 | Settling in |
| Established | 51+ | 24 | Stable — only big performances shift it |
A provisional pilot gaining the same "surprise" as an established pilot will move their rating twice as fast (48/24 = 2x).
What this looks like in practice
A new pilot enters their first competition rated 1500. In a group of 8 with average rating 1550, they score well — finishing 2nd. Their K-factor of 48 might give them +15 points per round. After a 10-round competition, they could jump from 1500 to 1620.
An established pilot (200+ groups) in the same situation with K=24 would gain about +7 per round — moving from 1550 to 1620 over the same event.
Group Size Normalization
Groups range from 3 to 16 pilots. The system applies two layers of group-size adjustment:
1. Matchup normalization: The rating change is divided by sqrt(N-1) so that having more pairwise comparisons doesn't automatically create larger swings:
| Group Size | Normalization Factor | Effect |
|---|---|---|
| 3 pilots | sqrt(2) = 1.41 | Moderate per-group impact |
| 6 pilots | sqrt(5) = 2.24 | Slightly diluted per matchup |
| 10 pilots | sqrt(9) = 3.00 | Many matchups, each counts less |
| 16 pilots | sqrt(15) = 3.87 | Lots of information, gentle per-pair |
2. Small-group K-factor scaling: The K-factor is further scaled relative to a reference group size of 8 pilots. Groups smaller than 8 produce proportionally reduced rating changes:
effective_K = K × min(1.0, (N - 1) / 7)
| Group Size | Scale Factor | Effect |
|---|---|---|
| 3 pilots | 0.29 | ~70% reduction — minimal rating impact |
| 4 pilots | 0.43 | Significant reduction |
| 6 pilots | 0.71 | Moderate reduction |
| 8+ pilots | 1.00 | Full K-factor applied |
This prevents rating inflation from small local events where a strong pilot repeatedly beats 2–3 weak opponents across many rounds. Dominating a 4-pilot group over 15 rounds produces far less gain than performing well in a single round at a major competition with 12-pilot groups.
Inactivity Decay
A rating should reflect current ability, not historical peak. If a pilot stops competing, their rating gradually decreases:
- Grace period: 6 months of inactivity before any decay begins
- Decay rate: 3 points per month after the grace period
- Floor: Rating cannot fall below 50% of the distance between 1500 and your peak
Decay Example
A pilot with a peak rating of 1800 stops competing:
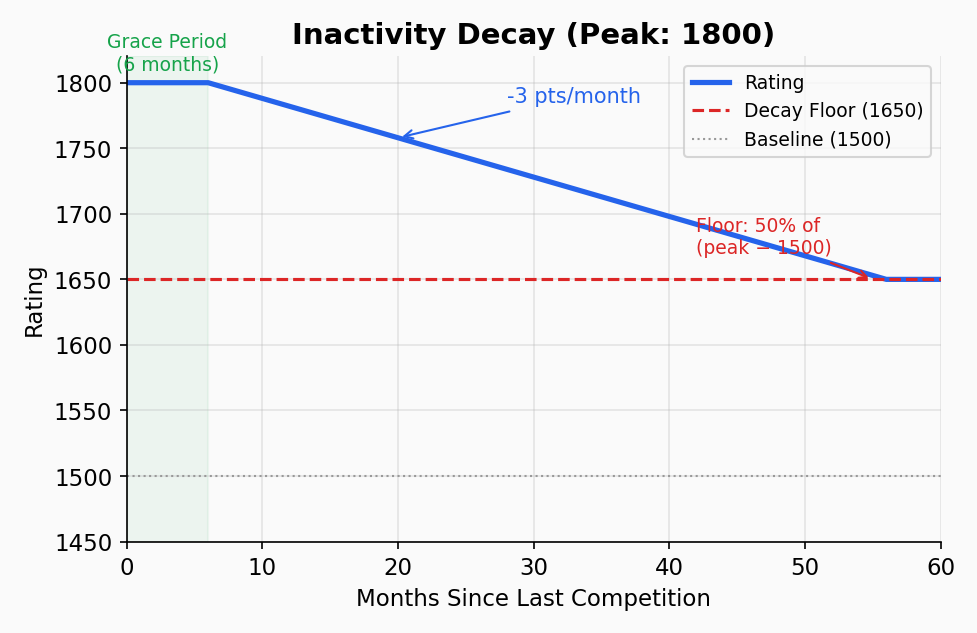
Floor calculation:
floor = 1500 + (peak - 1500) × 0.5
     = 1500 + (1800 - 1500) × 0.5
     = 1650
After 6 months: no change (grace period) After 12 months: 1800 - (6 × 3) = 1782 After 18 months: 1800 - (12 × 3) = 1764 After 24 months: 1800 - (18 × 3) = 1746 After 56 months: would calculate to 1650 — hits floor, stops
The floor ensures that a pilot who was once world-class doesn't decay all the way to beginner level. Their history is acknowledged — but they still need to prove current form by competing.
Decay is Real, Not Cosmetic
When a pilot returns after a break, their rating has already been reduced. They re-enter the system at their decayed rating and must earn their way back up through results. This ensures the leaderboard always reflects who is performing well now.
Ranked vs Unranked
To appear as a ranked pilot on the leaderboard, you need:
- At least 30 group appearances (roughly 3–4 full competitions)
- At least 4 distinct competitions
Until these thresholds are met, a pilot has a rating (visible in their profile and history) but doesn't receive a numbered rank on the leaderboard. This prevents a single strong weekend from placing someone at #1.
Round Batching
Within a competition round, multiple groups fly simultaneously. The system processes all groups in a round using the same pre-round ratings, then applies all changes at once. This means:
- Group A and Group B in the same round don't influence each other's calculations
- Your round 3 performance is evaluated against ratings that include rounds 1 and 2
- No pilot gets an advantage from the order groups are processed
Tie Dampening
In some tasks (especially Task A — Last Flight), large portions of a group may achieve the maximum score. When over 80% of pilots tie at the top, the system reduces the K-factor proportionally:
If >80% tied at max: effective_K = K × max(0.3, 1.0 - tie_fraction)
A group where 90% tie: effective_K = K × 0.3 (minimal rating movement) A group where 85% tie: effective_K = K × 0.15... capped at 0.3
This prevents large rating swings from rounds with little meaningful differentiation.
Peak Rating
Every pilot has a peak rating — the highest rating they've ever achieved. This never decays. It represents the best form a pilot has shown and serves as a historical record, separate from the current (potentially decayed) rating.
Summary
| Mechanism | Purpose |
|---|---|
| Pairwise within groups | Fair comparison (same conditions) |
| Margin-aware scoring | Every second matters |
| Task-specific margin scales | Ceiling-capped tasks credit small wins fairly |
| Expected vs actual | Upsets rewarded, beating weaker pilots less so |
| K-factor scaling | New pilots settle fast, veterans stay stable |
| Group size normalization | Consistent impact across group sizes; small groups produce less gain |
| Inactivity decay with floor | Reflects current form, respects history |
| Round batching | No processing-order advantage |
| Tie dampening | Prevents noise from maxed-out tasks |
| Ranked thresholds | Proven track record required |
The result: a single number that tells you how a pilot stacks up against the global F3K field right now — updated after every competition, grounded in head-to-head performance, and resistant to gaming through weak fields or cherry-picked events.